
.jpeg)
One of the most widely used programs worldwide is Excel. It is used by millions of people and companies for a wide range of tasks, from basic accounting and data entry to more complex statistical and data analytics. But what many people don't know is that when Excel is combined with Power BI, another Microsoft tool, users may significantly expand Excel's power, save time, and become more productive.
For many years, Microsoft Excel has been the preferred reporting tool for companies. However, Power BI provides businesses with strong analytics and reporting capabilities. Faster statistical function testing, visualization experimentation, and computations across large datasets are a few benefits. The capacity to quickly recombined fields to generate answers on the spot is another benefit.
Thanks to Power BI, business intelligence is now accessible to every team member who needs to view data and make choices. Any significant decision can be supported by trustworthy knowledge. With Power BI, data is evaluated and updated instantly, enabling teams to make decisions based on accurate information.

In this blog will discuss how power bi will be useful for excel users
Power BI may offer users several benefits that enhance their proficiency with data analysis and visualization when combined with Excel. Excel users can gain these seven advantages by incorporating Power BI into their daily work.

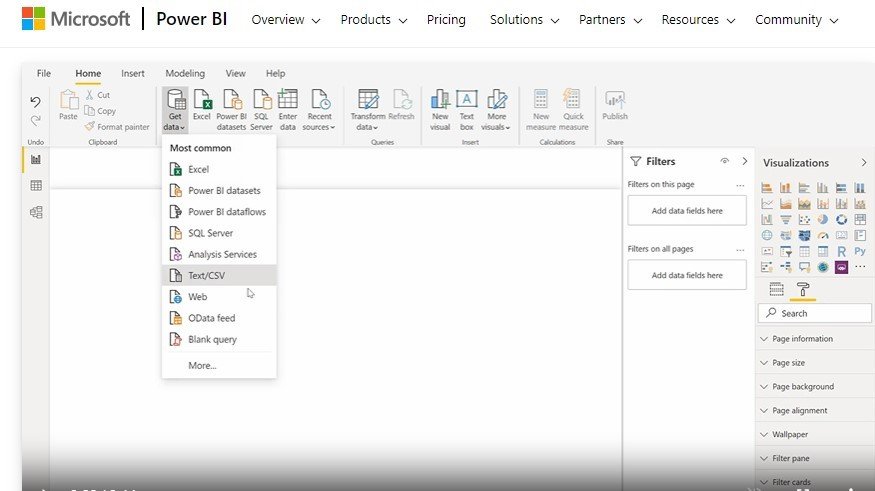
1.Connect to your data, wherever it is
Access data from hundreds of supported on-premises and cloud-based sources, such as Dynamics 365, Salesforce, Azure SQL DB, Excel, and SharePoint. Ensure it’s always up to date with automated, incremental refreshes. Power BI Desktop enables you to develop deep, actionable insights for a broad range of scenarios.
2.Prep and model your data with ease
Save time and make data prep easier with data modelling tools. Reclaim hours in your day using the self-service Power Query experience familiar to millions of Excel users. Ingest, transform, integrate, and enrich data in Power BI.
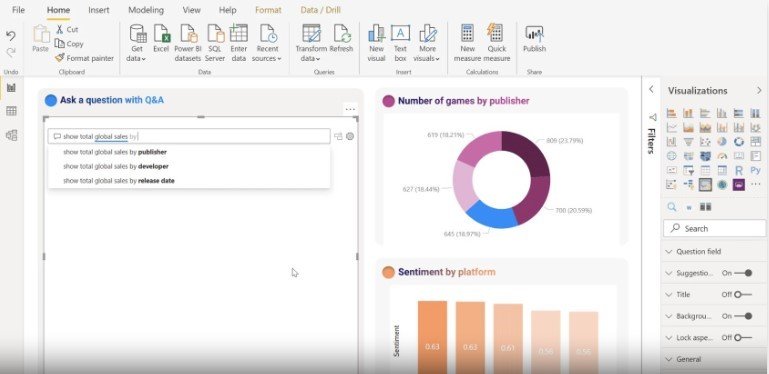
3.Provide advanced analytics with the familiarity of Office
Dig deeper into data and find patterns you may have otherwise missed that lead to actionable insights. Use features like quick measures, grouping, forecasting, and clustering. Give advanced users full control over their model using powerful DAX formula language. If you’re familiar with Office, you’ll feel at home in Power BI.
Explore your data, automatically find patterns, understand what your data means, and predict future outcomes to drive business results. The new AI capabilities—pioneered in Azure and now available in Power BI—require no code, enabling all of your Power BI users to discover hidden, actionable insights and drive more strategic business outcomes.
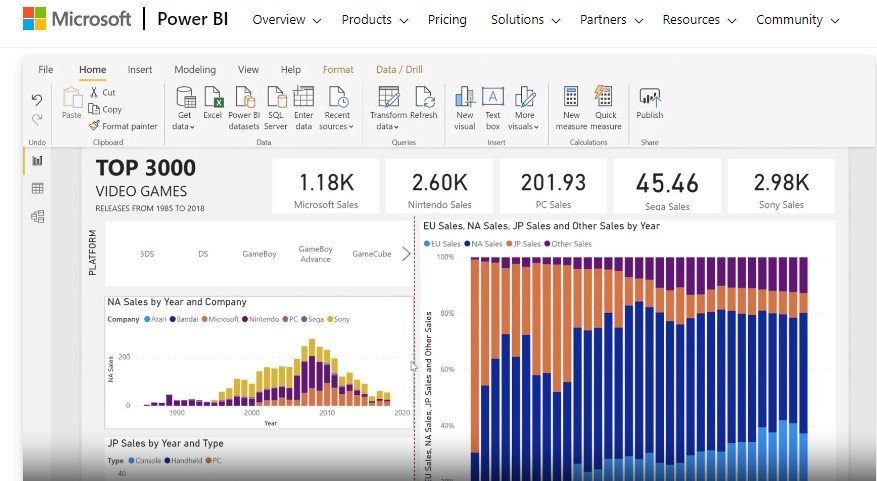
Create stunning reports with interactive data visualizations. Tell your data story using a drag-and-drop canvas and hundreds of modern data visuals from Microsoft and partners—or create your own, using the Power BI open source custom visuals framework. Design your report with theming, formatting, and layout tools.
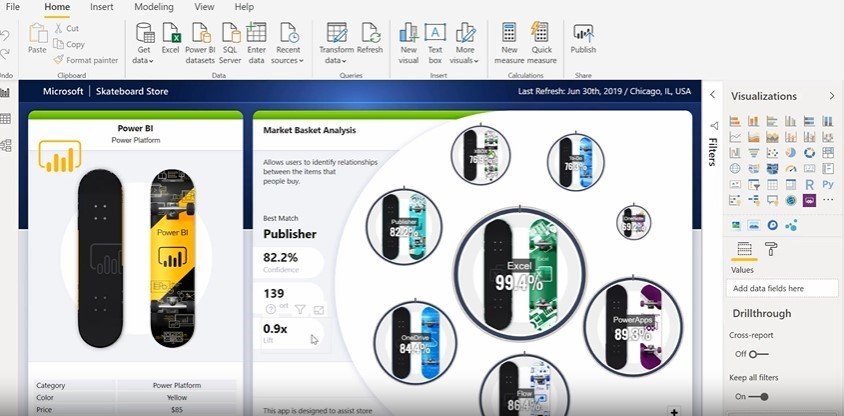
6.Author for everyone, anywhere

7.Author for everyone, anywhere
Get visual analytics to the people who need it. Create mobile-optimized reports for viewers to consume on the go. Publish from Power BI Desktop to the cloud or on-premises. Embed reports created in Power BI Desktop into existing apps or websites.

Conclusion:
To summarize, the amalgamation of Excel and Power BI augments the potential of conventional spreadsheet research, furnishing users with a formidable and unified arena for data investigation, visualization, and deduction. Adopting this integrated strategy becomes a strategic advantage as firms grow, allowing users to get more value out of their data-driven projects.
Copyright Bitonlinelearn © 2021. All Rights Reserved | Design and Developed By BITINFOTECH